Everyone agrees metrics are critical for making data-driven decisions, but they can be hard to prioritize when you’re up against a tight deadline or juggling multiple priorities. At Nava, we believe that it’s always worthwhile to invest in metrics upfront — and to right-size your strategy to your situation. Making metrics visible across an organization can help teams stay focused on outcomes.
Let’s take a look at a couple of different government agencies that partnered with Nava, each with their own timelines, goals, and constraints. In each situation, our product managers adapted the metric strategies to meet the unique needs of our clients and their program goals.
In California, Nava partnered with the state’s Employment Development Department (EDD) to rapidly build a web application for people to confirm their status for unemployment benefits during the COVID-19 pandemic. Nava also worked with the state of Vermont to build the first component of the state’s integrated benefits portal. This was a secure, mobile-first website that consolidated Vermonters access to enrollment and eligibility processes for Vermont’s health and financial benefit systems, including Medicaid for the Aged, Blind, and Disabled and Supplemental Nutrition Assistance Program (SNAP). Nava worked alongside both states to develop a metrics strategy that could monitor and grow with these programs.
While the scope of these programs is different, we approach building any metrics strategy — the definition, collection, and analysis of data to measure progress and make ongoing decisions about a technology product — with the same core ideas.
Align metrics with your program goals
From day one, government agencies need to define goals for their programs. From there, you can look at which metrics will help you measure your progress to hit these goals.
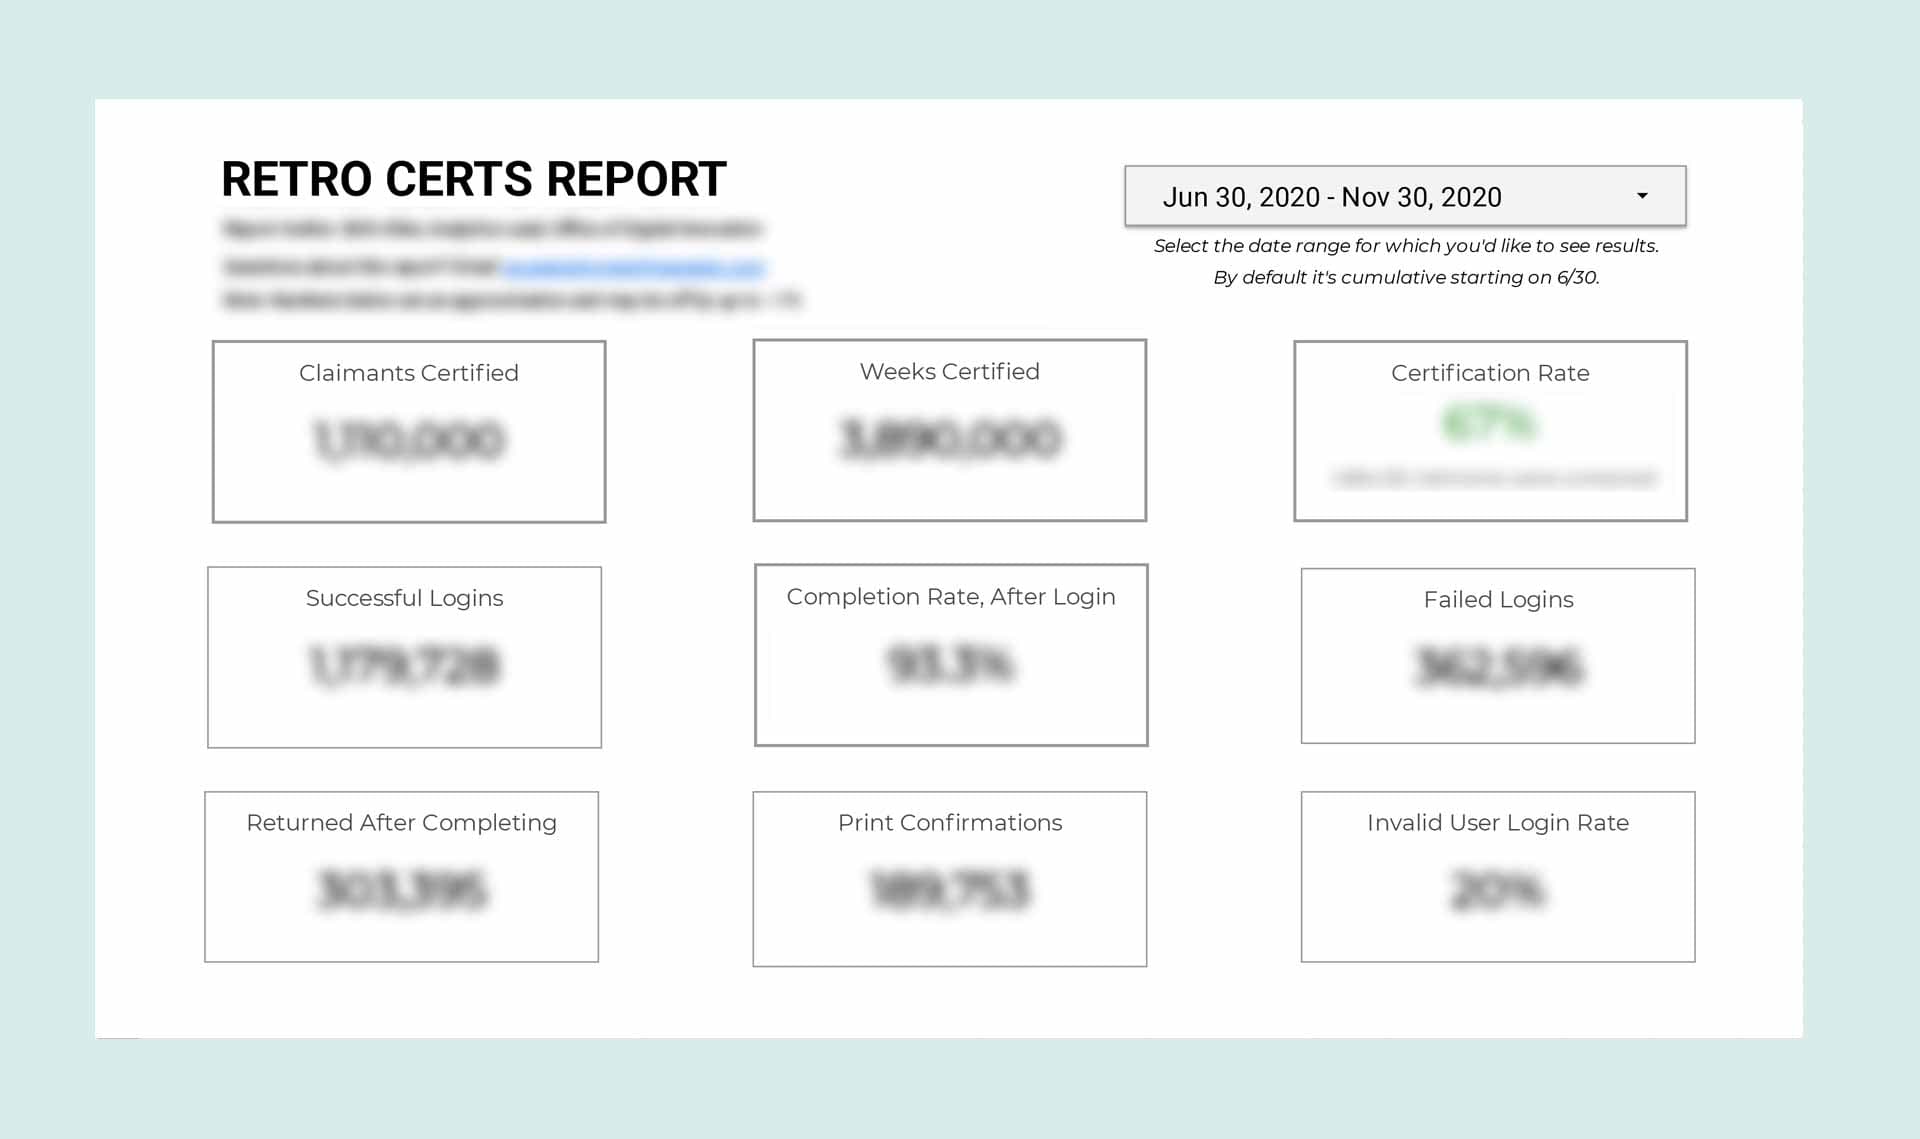
In California, for example, the state’s goal was to get unemployment benefits out to people who needed them as quickly as possible and confirm claimant’s eligibility. Our early conversations with state officials focused on how they would define success for this goal. Since we were tasked with building a secure and easy-to-use web application for existing claimants to confirm their unemployment status, we agreed on tracking login and completion rates to measure the web application’s effectiveness. Ultimately, we determined that the application was effective, based on the fact that 93 percent of people who logged in — 1.1 million in total —were able to complete the multi-page unemployment certification after we launched the web application.
We used a similar approach in Vermont. The state had a clear understanding of the goals that mattered to them. They wanted to make it easier for Vermonters to enroll and stay enrolled in state benefits that they’re eligible for. After identifying the most time-consuming barrier — submitting and processing paper documentation — we decided to build a tool to ease the process of submitting enrollment documents. Alongside Vermont’s team, we determined that we’d measure success by comparing the time it took for Vermonters to get through the enrollment process using our tool with the time it took using the existing process. Tracking this metric allowed us to discover that our uploader tool reduced the number of days it took for Vermonters to reach eligibility determination by 44 percent. The metrics confirmed that we were helping to reach Vermont’s program goal.
Remember to:
Meet with program stakeholders to define program goals.
Use those goals to define which metrics will help measure program success.
Start with something small and simple
When collecting data about a product or a program, there are dozens of things you could measure. So how do you choose? To start, don’t worry about choosing the perfect metric right from the get go. The best way to choose the right one is to dive in, try different things, and be willing to change course. You should also use any preexisting data.
In California, our main goal was to ensure people could complete a temporary online form for confirming their unemployment status. Early on, we experimented by tracking different metrics in Google Analytics and manually compiling that information into a spreadsheet that we shared with partners. It was a relatively quick and easy process.
Collecting this information showed us which metrics were most useful for measuring progress toward our goal, such as tracking the number of successful logins to the application form. We then worked with the state to build a Google Analytics dashboard that reflected the information we determined was most useful. Starting with a simple data spreadsheet allowed us to determine which data was most useful for us to look at before investing time in building the more robust, automated dashboard.
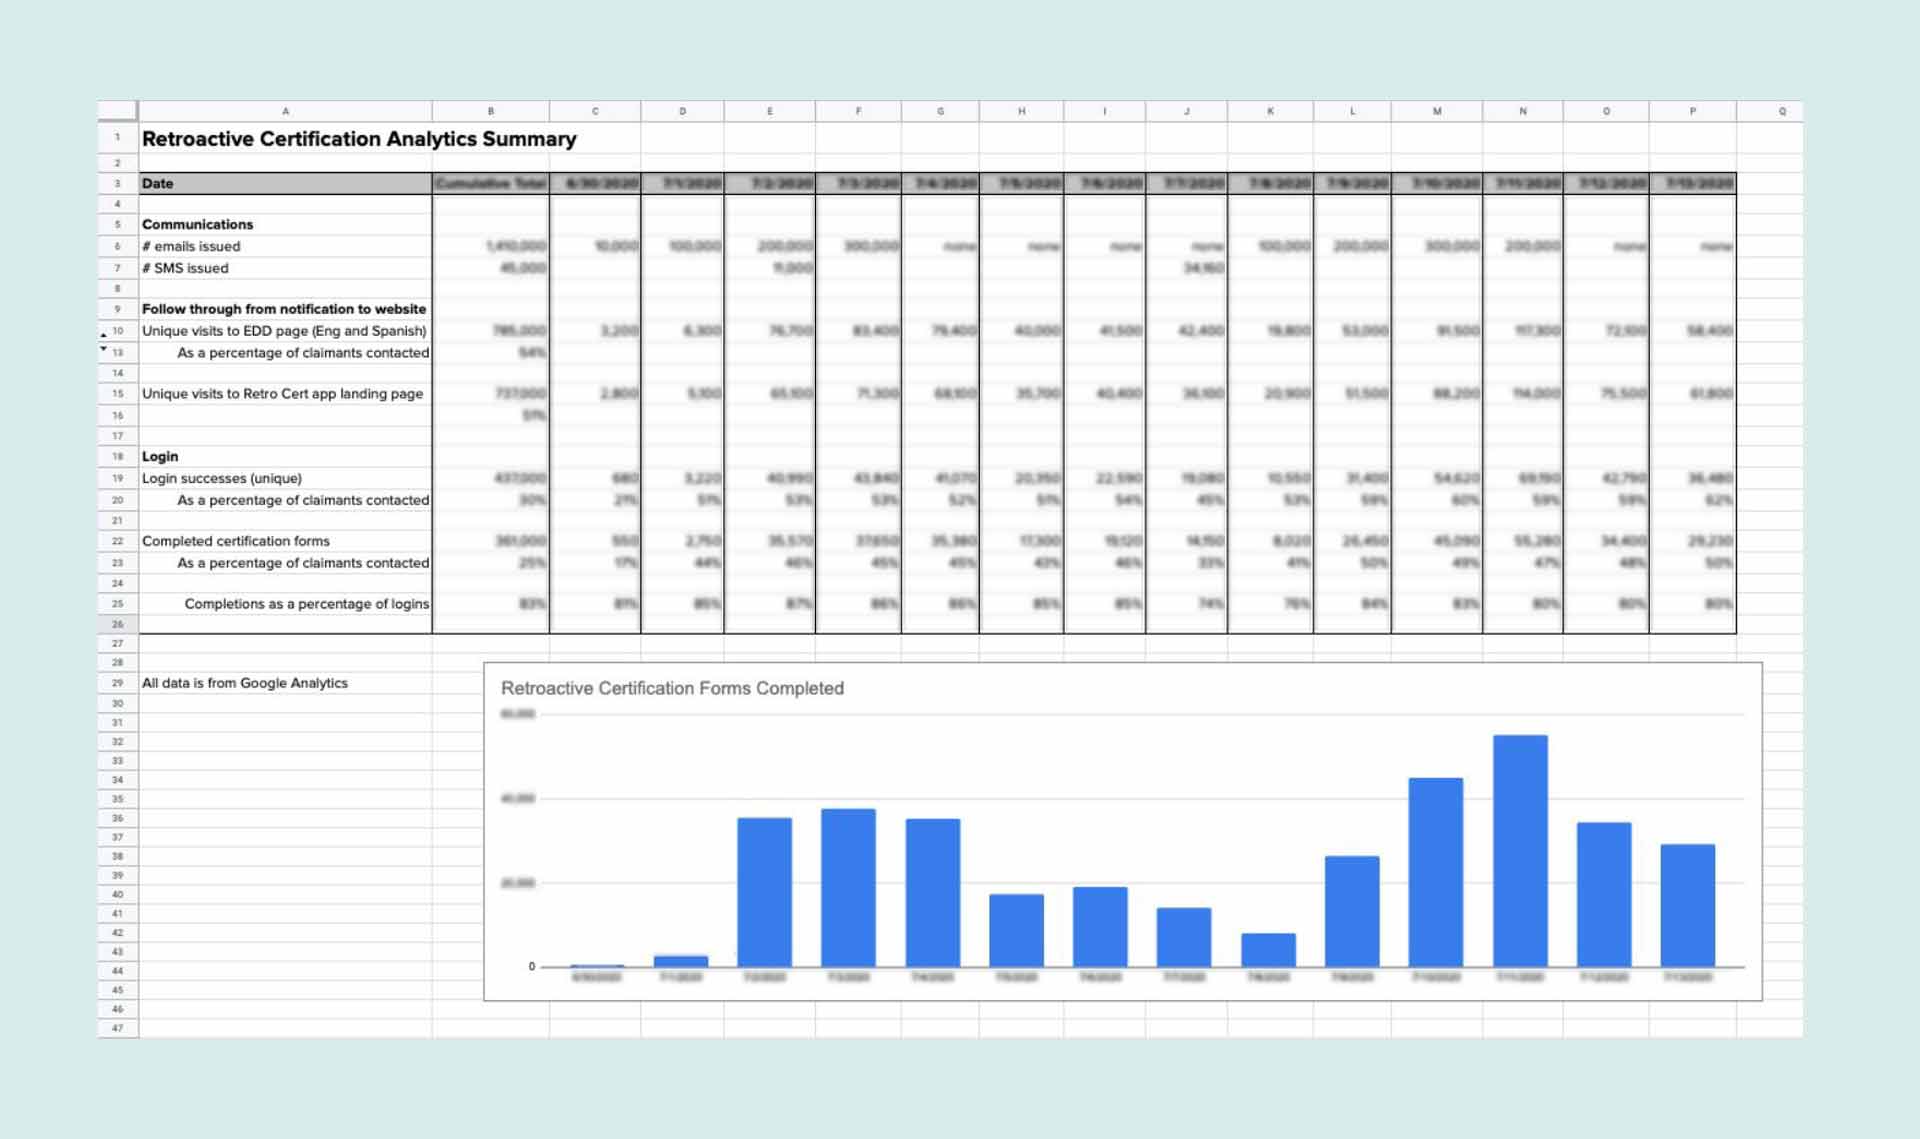
Starting with something small and simple can mean manually collecting and analyzing data in a spreadsheet before building out a robust dashboard.
After using a simple spreadsheet to collect and analyze data, we knew what kind of data should be surfaced. We used what we learned to build a more robust metrics dashboard.
Starting small can also mean initially rolling out a new tool to only a subset of users. Using this soft launch or pilot method allows you to measure success metrics at a more manageable scale, allowing development teams to quickly identify and fix any issues before the tool is released to a larger group.
In California, we planned a phased, soft launch of our retroactive certification form, emailing a link to 10,000 people on the first day, which was less than 1 percent of the total group of 1.6 million claimants. We then increased to 100,000 people on the second day, and kept increasing each day as we gained confidence that the form was performing. By monitoring Google Analytics, we determined within the first few hours of the first day that a percentage of all users were not able to log in. The team rapidly diagnosed and fixed the issue in a few hours and only this small subset of people were affected.
We also rolled out our Vermont integrated benefits tool to a small group of 50 Vermonters, tracking the time it took for claimants to get through enrollment. We then measured this pilot group against a baseline group of people who used the process without our tool. Ultimately, we determined that the people who used the pilot enrolled in almost half of the time compared to the previous process. Using this small group of people allowed us to keep a close eye on our metrics for success.
Remember to:
Experiment with collecting different metrics to start to see what proves most useful.
Try a soft launch of your new product to start so you can initially measure metrics at a smaller scale.
Plan to iterate over time
You should plan to adapt your metrics strategy over time. You should respond to what you learn and make sure you’re capturing the data you need.
In California, after the initial launch of the retroactive certification form, we worked with EDD on a communications plan to reach the claimants who had not yet completed the retroactive certification form using a combination of email notifications, SMS messages, and messages within the unemployment portal. In order to track this communications plan’s effectiveness, we created custom links that let us track open rates on each communication channel. We discovered that open rates for the messages sent within the unemployment portal were only 18 percent. So we adjusted our communications plan to address this: we relied more on SMS messages, increased the frequency of messages in all channels, and simplified the messaging to be more direct and urgent. Our improved communication strategy resulted in reaching an additional 14 percent of claimants in the final three weeks. Adapting our data collection strategy to include tracking open rates helped us improve our communications plan, which in turn helped more claimants complete the form.
In Vermont, we knew that our metrics strategy had to include a comparison between people who enrolled through our portal versus people who went through the previous process. In order to make that comparison, we needed to pull metrics — in this case, the time it took to get through enrollment — from existing systems to get a sense for a baseline metric. However, after digging through multiple data sets and automated outputs from Vermont’s economic assistance legacy system, we realized that it didn’t provide the reliable data and reporting needed to define baselines for each metric. Instead, the best way to determine this baseline was to review a set of sample cases and gather the data manually. Changing our data collection strategy ensured we were using an accurate baseline.
Remember to:
Review and adjust your metrics strategy as you continue to use it.
Talk about the metrics with your team
It’s not enough to have a ton of data. You’ll need to do the work of interpreting the numbers and sharing it to generate conversation about what’s happening with your service and why. Teams should regularly share and discuss their findings both for transparency and to allow colleagues to participate in the process of using data to make decisions.
In California, we sent twice-weekly email updates to our partners so that they could understand top-level findings quickly and easily. These emails highlighted our progress and included data on the number of successful logins and the certification rate. It also linked to our Google Analytics dashboard so that partners could review and understand our findings in detail. Additionally, we met twice a week during the product launch to talk through our findings with colleagues.
Reviewing and responding to data from the start will show you if you’re going in the right direction, and where you need to adjust course to meet program goals. For example, in California, regular review of the data made it clear to our stakeholders that form completions slowed down significantly when claimants weren’t getting reminders from EDD about needing to complete the form (See graph below). As a result, they decided to increase the frequency of reminders.
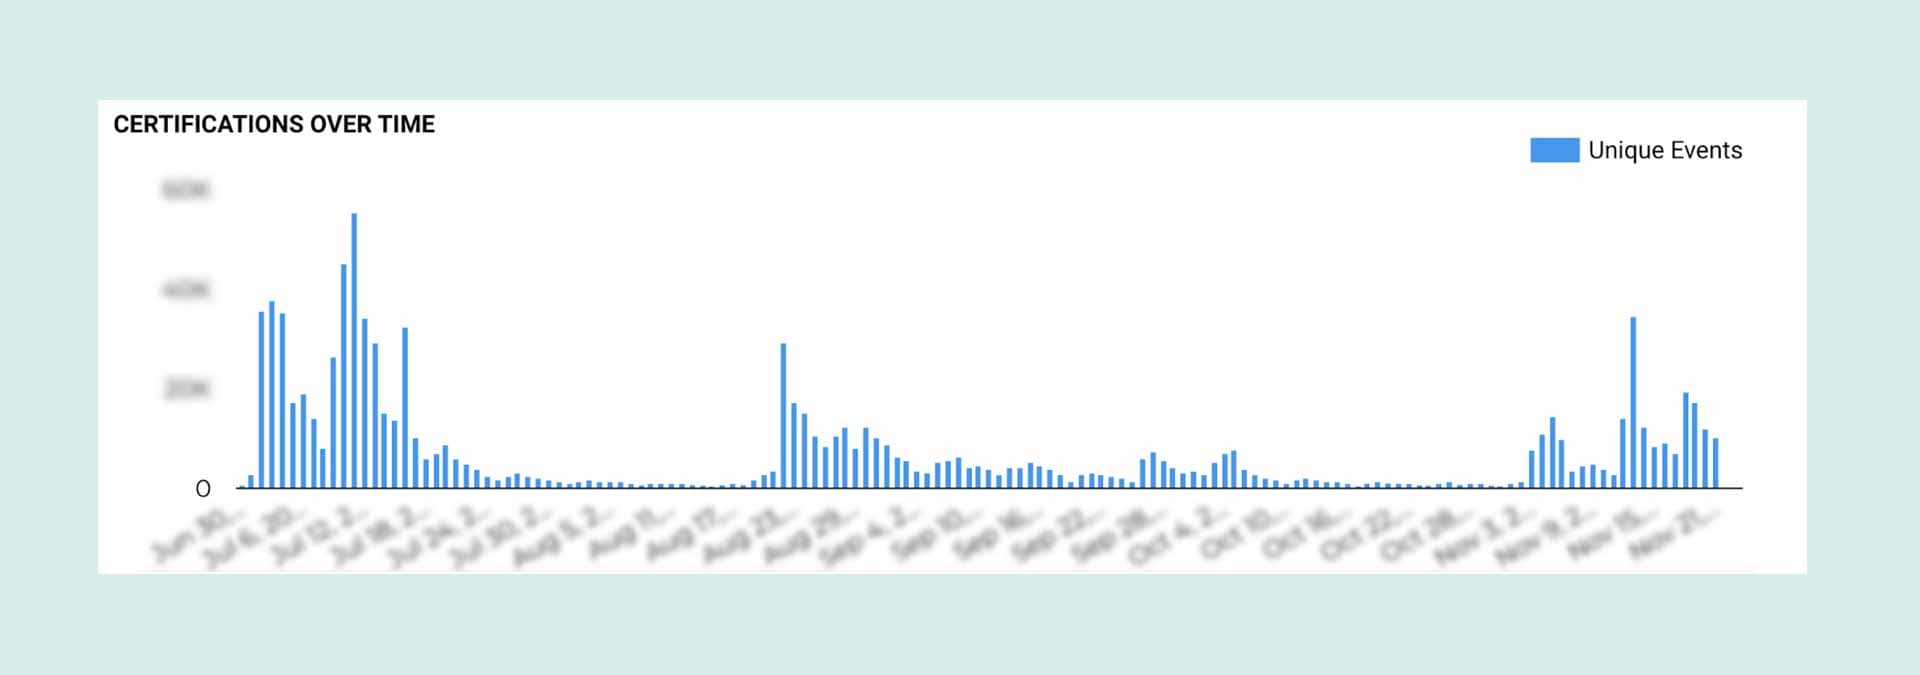
The spikes correspond to communications campaigns, working with our government partners to increase their communications plan in order to maximize the response rate before the deadline in November 2020.
Remember to:
Regularly share metrics findings with stakeholders.
Use these findings to generate conversations and make decisions.
Whether you’re working on a small project, building a tool during a crisis, or launching an entirely new program, it’s crucial that you take time to define, collect, and use metrics and then follow the data from the start. After all, you can’t manage what you can’t measure.
Written by

Director of Partnerships and Advocacy

Director of product

VP of Product