Improving access to government services is essential to rebuilding trust in institutions, strengthening our democracy, and creating a more just society — especially for vulnerable populations. Our commitment to diversity, inclusion, and equity not only reflects our values as a public benefit corporation but also enriches our ability to do this work.
When we started putting Nava’s Diversity, equity, and inclusion report together, our first and main goal was to share where we are now and where we want to be — to hold ourselves accountable for our progress.
The report gives us a baseline for our long term goal: for Nava staff to comprise majority BIPOC by 2025. (We define BIPOC as anyone who identifies as something other than only White/Caucasian.) Publishing this data is just one step to help us reach this year’s goal: to identify, prioritize, and address inequities at Nava.
Building trust and co-creating goals
Getting input and feedback from Nava’s Employee Resource Groups (ERGs) from the beginning of this project was essential to our success. In addition to providing community and support for fellow Navanauts, ERGs contribute to critical conversations about how we can grow as a diverse, equitable, and inclusive workplace.
Brainstorming with ERG members and other stakeholders helped us to develop user needs and project goals, to understand what kind of information was important for people to see, and to understand what people really didn’t want to see.
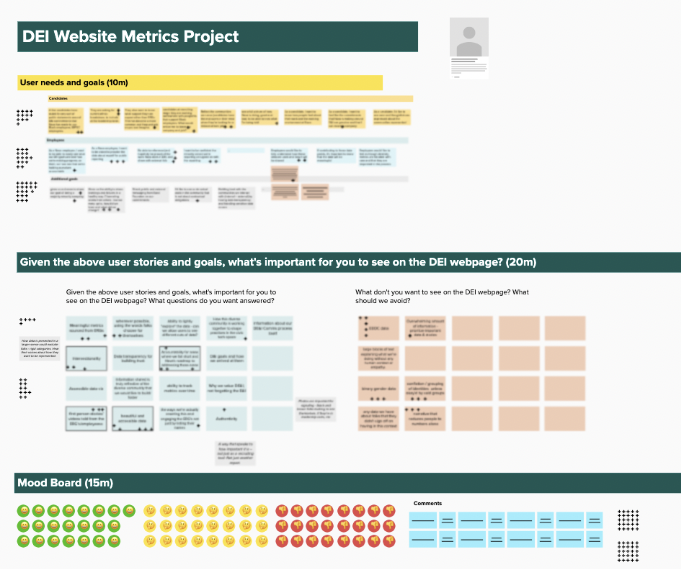
Screenshots of comments left during brainstorming sessions performed with employee resource groups.
Together, we identified our primary users as potential employees — people who are evaluating Nava before applying for a job here. They tend to have a lot of questions about what diversity, equity, and inclusion efforts and support looks like at Nava, what the current staff looks like, and they want to see more about what our goals are and how we’re holding ourselves accountable to meeting those goals.
We also listened about and agreed on the importance of collecting diversity data in an inclusive and respectful way. In particular, folks wanted transparency around how their data would be collected and used. And they didn’t want their identities to be erased or conflated without permission.
After reviewing examples of diversity reports, we knew we needed to create a new model for both collecting and visualizing the data that would be right for Nava and meet the needs of both our potential and current team members.
Ultimately, we settled on the following goals:
Collect diversity data in an inclusive, respectful way
Build a sustainable process and model for collecting and sharing data
Provide diversity, equity, and inclusion info for potential employees
Designing the survey
To make sure we asked the right questions and had inclusive categories on the survey, we solicited several rounds of feedback from ERGs, other stakeholders, and our diversity, equity, and inclusion consultant BeInspired.
Even though we added questions and identities at the request of ERG members, we knew that some identities may still be missing, so we gave people the option to write-in their own. We prioritized having inclusive options on the survey over being able to compare the data to other data sets.
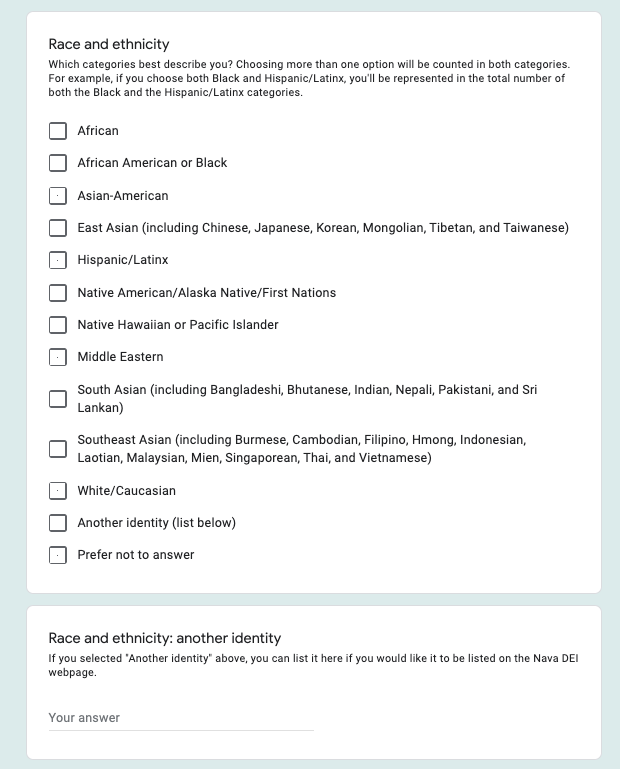
Screenshot of some of the questions included on the survey. The survey as a whole was optional to take, and each question was optional to answer.
One area we can definitely improve on is distinguishing between engineering and non-engineering roles. We originally included the question: “are you in a technical role?” But because we see all of the people who work in product management, program management, and design — as well as engineering — as “technical,” more than 83 percent of Navanauts could reply yes. And the pool got too big. We’ve already heard feedback that folks are interested in seeing race and ethnicity and gender identity breakdowns in engineering and other teams, so we’ll take that into consideration when we update the survey next year.
The survey as a whole was optional to take, and each question was optional to answer. Survey respondents were not asked to share their names or any identifying information about themselves, so the data was 100 percent anonymous. We ended up receiving responses from 83 percent of our staff.
Visualizing the data
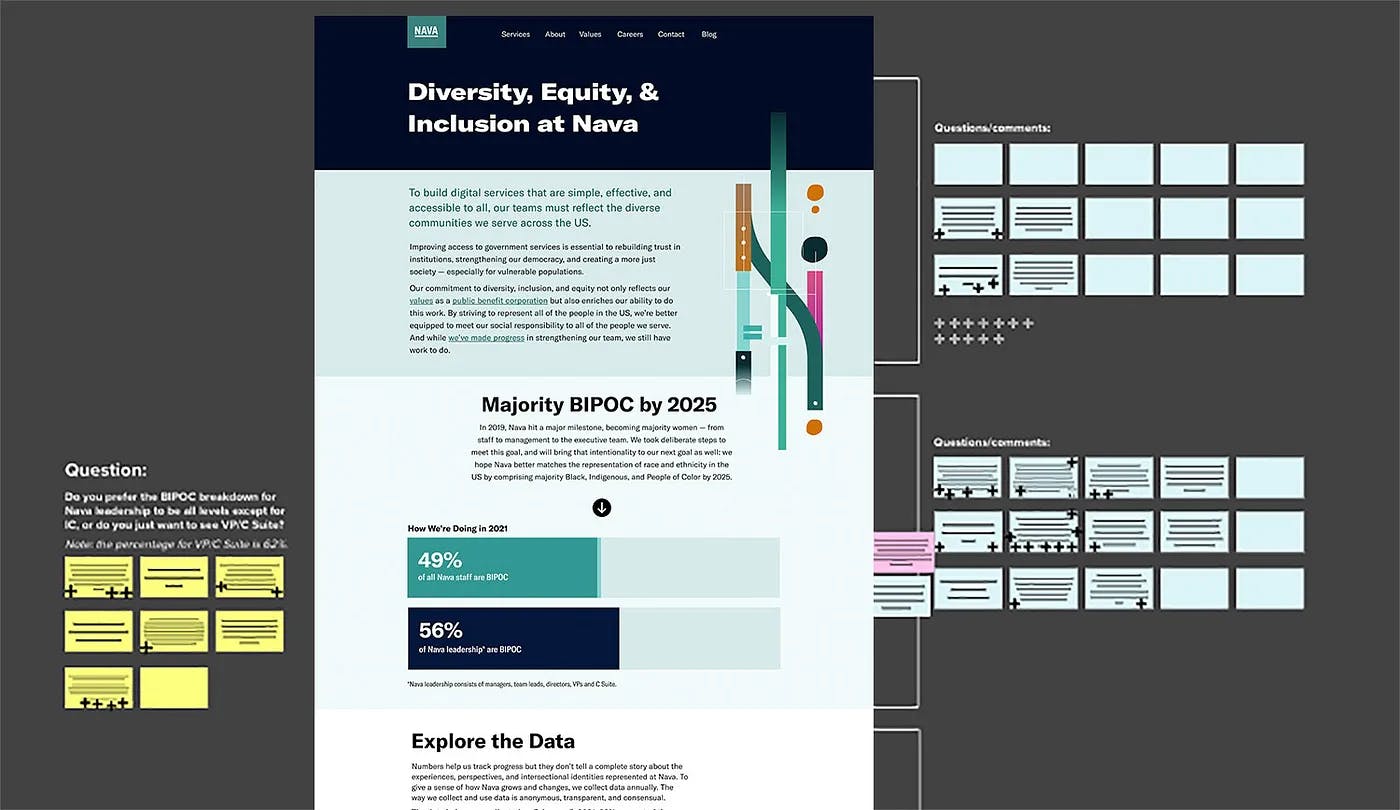
Screenshot of comments left by employee resource groups during a round of feedback.
Long before we even sent out the survey, we went through many rounds of iteration on the data visualization. We wanted people to first have an idea of how their sensitive information would be represented in the report before they shared it with us.
Working with wireframes and drafts of the data visualizations, we got five rounds of constructive feedback from ERGs, including what worked and what needed to be changed or more clear. People generally liked simple bar chart graphs that let them quickly compare the data. We tried visualizing the intersections of leadership levels, race and ethnicity, and gender identity in many different ways, but ultimately they were all too complex and confusing. So, we decided to stick with simple bar charts for that data as well.
With each iteration and round of feedback, we also got more clear about the narrative we wanted to tell with the data, and on the page as a whole.
Analyzing the data
People are more than data. While we’re framing this conversation with charts, we know that people are more nuanced. We also know that people trusted us with their personal information, and we take that responsibility seriously.
Juweek Adolphe is the only person who had access to the raw data from the Google Forms survey. Google admins can not view the files unless they are shared directly.
Names and emails were not recorded, but each response was linked by a timestamp.
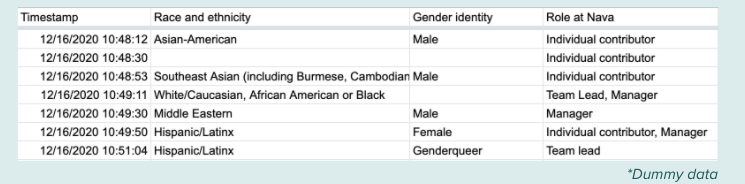
Screenshot that shows how collected data was formatted.
Once the data was collected into a Google Sheet, the data was cleaned and organized using two methods: a python script written by Juweek that parses through the data, and cleaned and organized manually via Google Sheets by Juweek.
To provide an overview of the communities present at Nava — and not a complete breakdown of every employee — responses are decoupled from one another. The most prominent examples of data decoupling include multi-racial employees (e.g. African-American/Black and East-Asian) and employees who identify as more than one gender. In both circumstances, the employee is included in all of the communities they selected. Ultimately, this means that our numbers exceed 100 percent.
Data retention
Upon publishing the diversity, equity, and inclusion report, the raw and aggregated datasets were deleted.
The work we’ve done over the past couple of months will be the foundation of Nava’s diversity, equity, and inclusion updates in the future. We’ll be sharing an updated report annually.
Special thanks:
The comms team worked closely with ERG leads and ERG communications representatives every step of the way, including the survey design and questions. Thank you Sheena Bryant, Afia Genfi, Mario Reynoso, Lauren Bermudez, Vanessa Berruetta, Kat Tipton, Sarah Ortiz Shields, JN Fang, Rutvi Gupta, Jessi Bull, and Tina Nguyen for being so generous with your time and providing the comms team with honest feedback throughout the whole process. And a big shout out to Senongo Akpem for all your design support and feedback along the way.